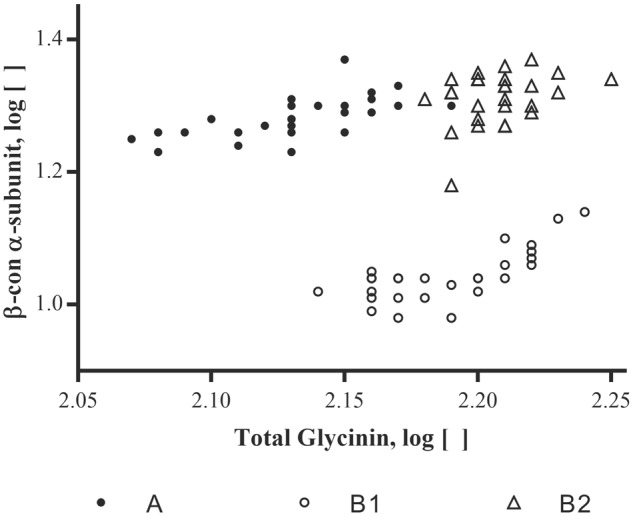
FIGURE 3.

Soybean varieties plotted for their log concentrations of β-conglycinin α-subunit versus the log concentrations of the summed total of the glycinin subunits (Total glycinin). Log concentrations are of the mean μg allergen(s)/mg total protein; each site location per variety and allergen (n = 3).
