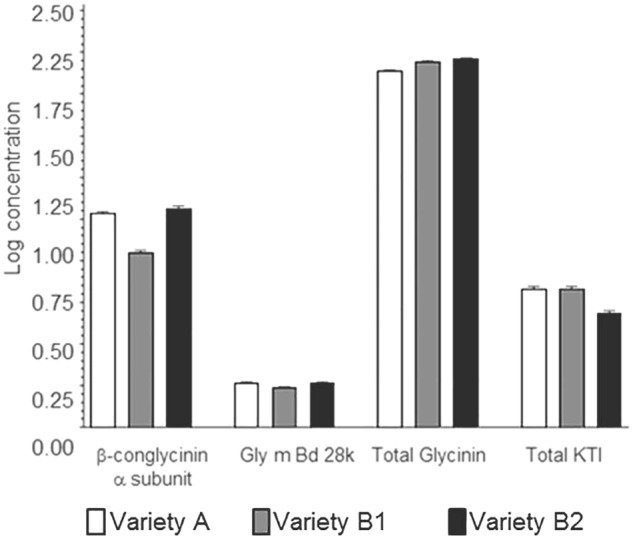
FIGURE 4.

Mean log concentrations of protein allergens by group and variety. Paralogous protein allergen concentrations were summed (individual allergens summed together into allergen groups for glycinin and Kunitz trypsin inhibitor proteins, respectively, for each site location). Data displayed is the mean and standard deviation for each of the varieties at all site locations.
