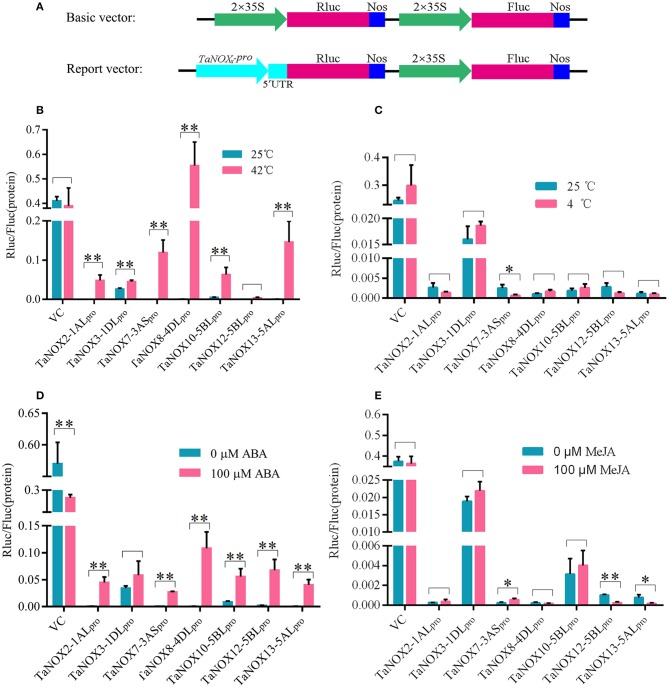
Figure 7.
Activity analysis of the promoters of TaNOXs under temperature stress and hormone treatments. (A) Schematic representation of the basic and report vector constructs. (B–E) The relative activity of the promoters of TaNOXs under temperature stress and hormone treatments. The activity analysis of the promoters represents the mean ± SD of data collected at least seven replicates. *P < 0.05; **P < 0.01.

