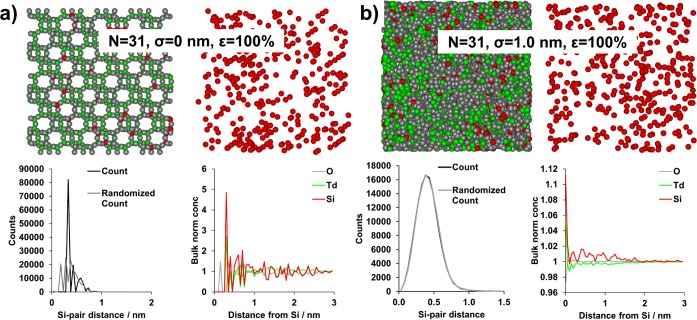
Figure 2.
Selected results of atom probe simulations for the largest island sizes simulated (NSi = 31) for 100% detector efficiency (ε) and two different spatial resolutions (σ). Each panel contains a 5 × 5 × 5 nm3 view of all atoms that were removed from the center of the larger simulated data set, as well as a view of only the Si atoms, with colors as shown in the radial distribution function (RDF) graph. Also shown are the nearest neighbor distributions (NNDs) for Si and the RDF for Si. Full results for all values of NSi, σ, and ε can be found in Figures S21 and S22. (a) NSi = 31, σ = 0 nm, and ε = 100%. (b) NSi = 31, σ = 1.0 nm, and ε = 100%. Note in (a) the view with only Si atoms has been slightly rotated as compared to the view with all atoms, so all Si atoms within the region of interest are visible. Movies of the ion distributions for the simulations are included as movie S3.

