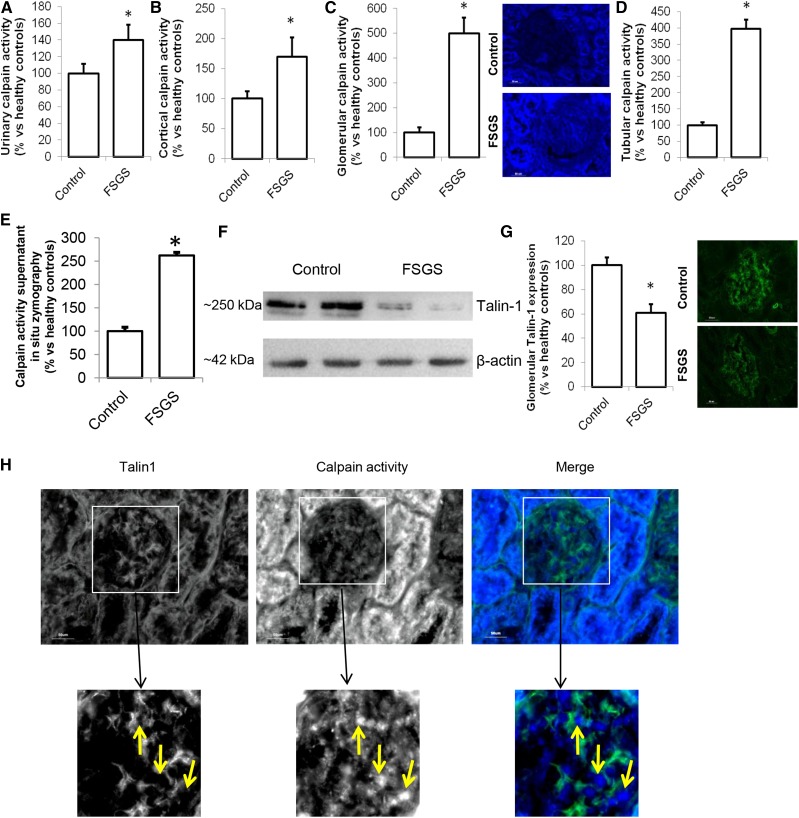
Figure 2.
Calpain activation occurs in glomeruli of patients with FSGS. (A) Calpain activity was determined in the urine of patients with FSGS (n=7) or healthy controls (control; n=5). (B) Protein was extracted from renal cortex samples, and a calpain activity assay was performed. Sections of the cortex were cut, and using an in situ zymography assay, (C) glomerular and (D) tubular calpain activity was determined. (E) Calpain activity in the section supernatant was measured and normalized to surface area of the section. (F) Western blot analysis was performed to determine the cortical expression of the calpain cleavage target Talin-1 (Talin-1–to–β-actin ratio: 1.22±0.17 in control versus 0.25±0.20 in FSGS samples). (G) Glomerular Talin-1 was costained with synaptopodin, and its expression was quantified. (H) Talin-1 was stained in combination with an in situ zymography for calpain activity in sections from patients with FSGS. (B–H) FSGS, n=3; control, n=5. *P<0.05 compared to healthy controls.

