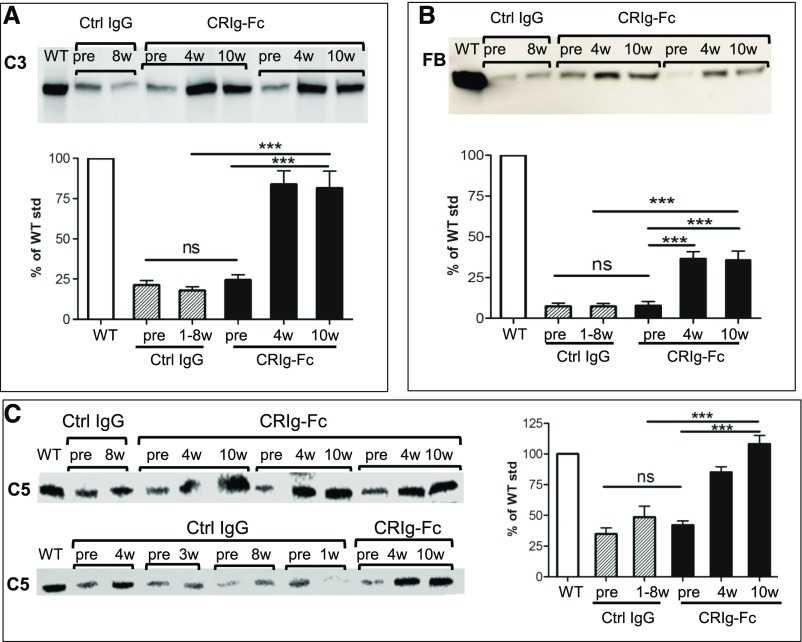
Figure 4.
CRIg-Fc treatment significantly elevated plasma C3, FB, and C5 levels in FHm/mP−/− mice. Western blot analysis of intact plasma C3 (A), FB (B), and C5 (C) in WT, control IgG–treated FHm/mP−/− mice, and CRIg-Fc–treated FHm/mP−/− mice. Bands shown in (A–C) denote intact C3 α-chain, intact FB, and intact C5 (nonreducing gel), respectively. Blot images show only representative mice in each group and the bar graphs show densitometry scanning of all mouse sera available for analysis (n=6 for the control IgG group and n=7 for CRIg-Fc group). Plasma samples in the control IgG group were from pretreatment or 1–8 weeks after treatment, depending on when the mice became moribund. Plasma samples from the CRIg-Fc treatment group were more reliably collected because of better mouse survival and those from pretreatment (pre) and 4 and 10 weeks after treatment were used for analysis. *** P<0.001 (one-way ANOVA with Tukey test). ctrl, control; std, standard.

