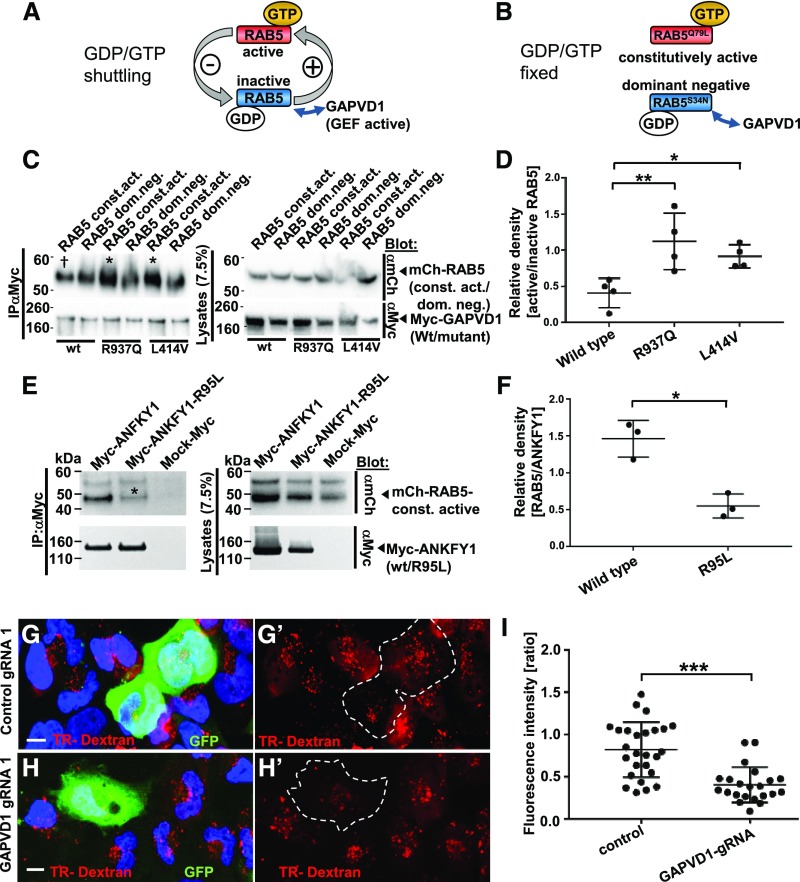
Figure 4.
Mutations of GAPVD1 that cause nephrotic syndrome increase the affinity to active RAB5, and GAPVD1 promotes dextran endocytosis. (A and B) Schematic showing that (A) RAB5 shuttles between active and inactive states dependent on binding to GTP/GDP, whereas (B) dominant negative and constitutively active RAB5 constructs are clamped to active and inactive states, respectively. (C) Overexpression and co-IP of mCherry-tagged RAB5 dominant negative (RAB5 dom. neg.) and constitutively active (RAB5 const. act.) constructs together with Myc-GAPVD1 reflecting the wild-type (WT) sequence or mutations causing nephrotic syndrome (R937Q and L414V). WT and mutant GAPVD1 interact with active and inactive RAB5. The mutant constructs of GAPVD1 show a stronger affinity to constitutively active RAB5 (asterisks) compared with WT GAPVD1 († sign). (D) Quantitation of density from precipitates analogous to (C) normalized to respectively precipitated RAB5 construct for co-IPs and shown as a ratio of RAB5 const. act. divided by RAB5 dom. neg. (n=4, P<0.05 or 0.01, respectively). (E) Overexpression and co-IP of mCherry-tagged constitutively active RAB5 together with Myc-ANFKY1 reflecting the WT sequence or the R95L mutation shows strongly reduced amounts of RAB5 precipitating with the mutant ANKFY1 (asterisk), indicating a reduced binding affinity. (F) Quantitation of density from precipitates of RAB5 protein analogous to (E) normalized to respectively precipitated Myc-ANKFY1 WT or mutant protein (n=3, P<0.05). (G–H’) Human podocytes transfected with plasmids expressing gRNA, Cas9, and GFP are exposed to Texas-Red-dextran (10 kD) for 30 minutes. Nuclei are marked by Hoechst 33342 in blue. (G and G’) Podocytes expressing control gRNA exhibit comparable Texas-Red-dextran endocytosis to the neighboring cells, whereas (H and H’) podocytes expressing a gRNA targeting GAPVD1 exhibit reduced tracer endocytosis. Scale bars represent 10 µm. (I) Quantitation of results from (G–H’). For both control gRNA or GAPVD1 targeting gRNA fluorescence intensity ratio is shown between gRNA-expressing cells and their nontransfected neighboring cells (n=2, approximately 25 cells each, P<0.001).

