Figure 3.
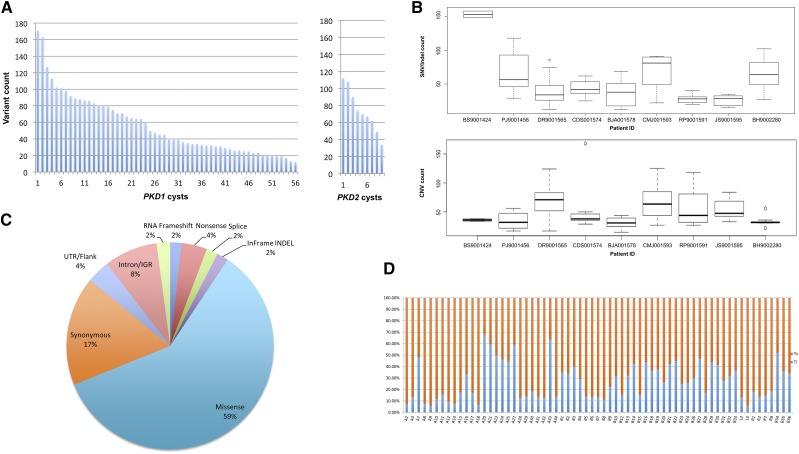
WES of renal cyst epithelia DNA identified a wide spectrum of somatic alterations in all samples. (A) Distribution of mutation (SNV, indel, and CNV) load identified by WES by cyst and by PKD1/2 genes (n=65). (B) The frequency of mutation alterations in cyst epithelia varied significantly among the patients. Alterations are classified by mutation type. SNV/indel and CNV distribution are shown in the top and bottom panels, respectively. (C) Frequency of all somatic SNV substitutions and indel mutations detected in 65 renal cyst epithelia samples from nine patients with ADPKD. Alterations are colored according to mutation type. (D) Transition (Ti) to transversion (Tv) plot of SNVs detected. IGR, intergenic region; UTR, untranslated region.

