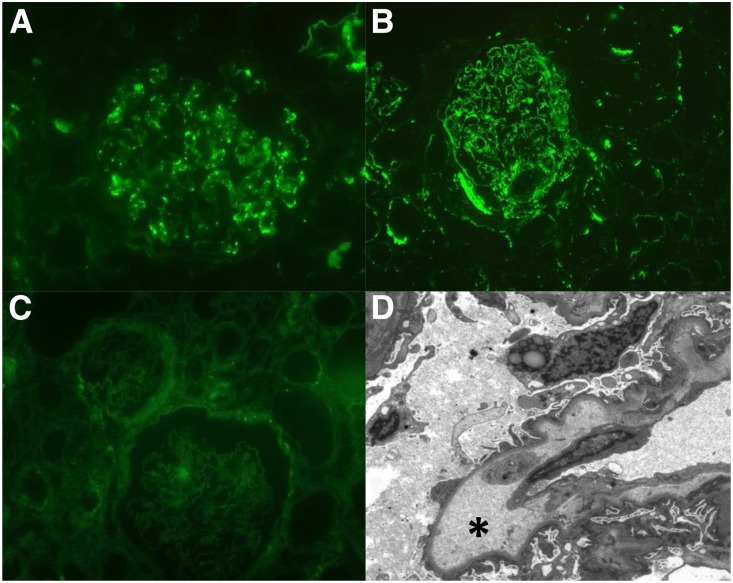
Figure 3.
C3c and C5b9 staining reflect in vivo complement activation in hypertension–associated thrombotic microangiopathy (TMA) but not hypertensive arterionephrosclerosis. Representative immunofluorescence microscopy images of (A) C3c and (B) C5b9 deposits along the renal vasculature in severely hypertensive patients with TMA, whereas (D) electron dense deposits were not found; widening of the subendothelial space (asterisk) was often acknowledged. (C) C3c was not linked to hypertensive arterionephrosclerosis. Original magnification, ×400 in A and B; ×200 in C; ×1900 in D.

