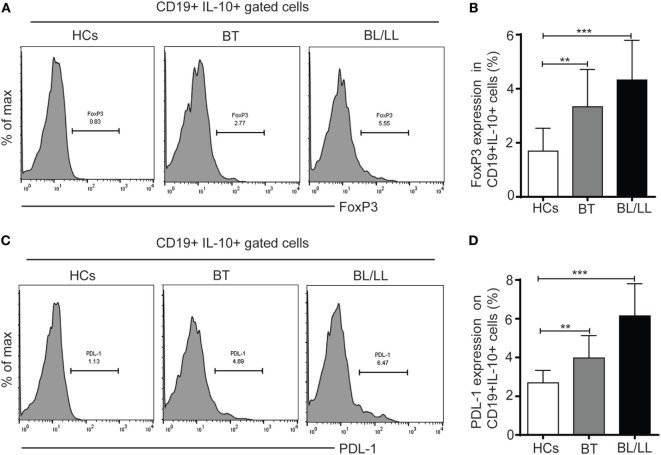
Figure 2.
FoxP3 and PDL-1 expression in regulatory B cells (Bregs) (CD19+IL-10+). (A) Representative histogram showing expression of FoxP3 in Breg (CD19+IL-10+) cells in peripheral blood mononuclear cells (PBMCs) isolated from peripheral blood of HCs (n = 10), borderline tuberculoid (BT), and BL/LL patient (n = 25). (B) Graph plot is showing expression of FoxP3 in HCs and leprosy patients (BT, BL/LL). (C) Representative histogram showing expression of inhibitory molecule receptor (PDL-1) on Breg (CD19+IL-10+) cells in PBMCs isolated from peripheral blood of HCs, BT, and BL/LL patient. (D) Graph plot is showing expression of PDL-1 on HCs and leprosy patients (BT, BL/LL). Mean ± SD values are shown in each set while p value < 0.05 was considered significant. 100,000 cells were acquired and analyzed by flow cytometry. Data analysis was performed with flowjo software. Statistical analysis was done using Student’s t-test for unpaired samples (*p < 0.05; **p < 0.005; ***p < 0.0005).

