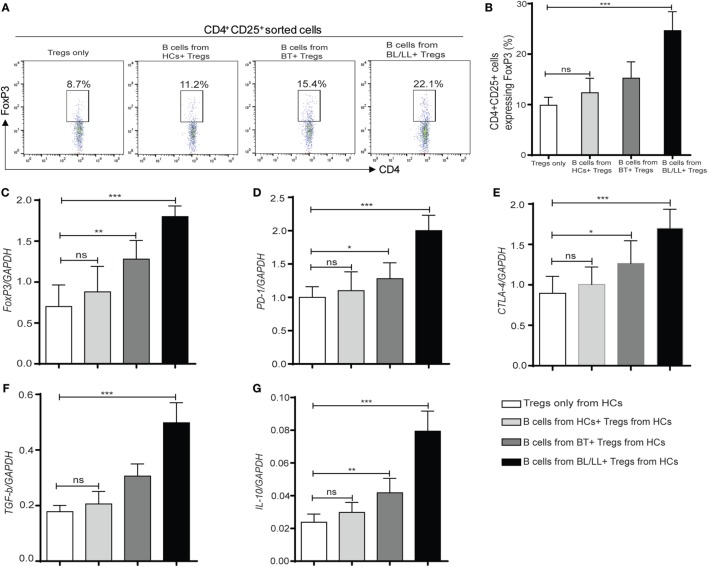
Figure 4.
Regulatory effect of regulatory B cells (Bregs) on Tregs (CD4+CD25+). (A,B) Flowcytometric and graph plot representations of CD4+CD25+ T cells expressing FoxP3. Bregs (CD19+IL-10+) derived from [HCs, borderline tuberculoid (BT) and BL/LL, n = 10] were cocultured with Tregs (CD4+CD25+) derived from HCs (n = 10) and Tregs were studied by flow cytometry. (C–G) mRNA expression of FoxP3, inhibitory molecules (PD-1, CTLA-4), TGF-β, and IL-10 in Tregs (CD4+CD25+) cocultured with Bregs isolated from HCs, BT, and BL/LL (n = 10). Mean ± SD values are shown in each set while p value < 0.05 was considered significant. 50,000 cells were acquired and analyzed by flow cytometry. Data analysis was performed with flowjo software. Statistical analysis was done using Student’s t-test for unpaired samples (*p < 0.05; **p < 0.005; ***p < 0.0005).

