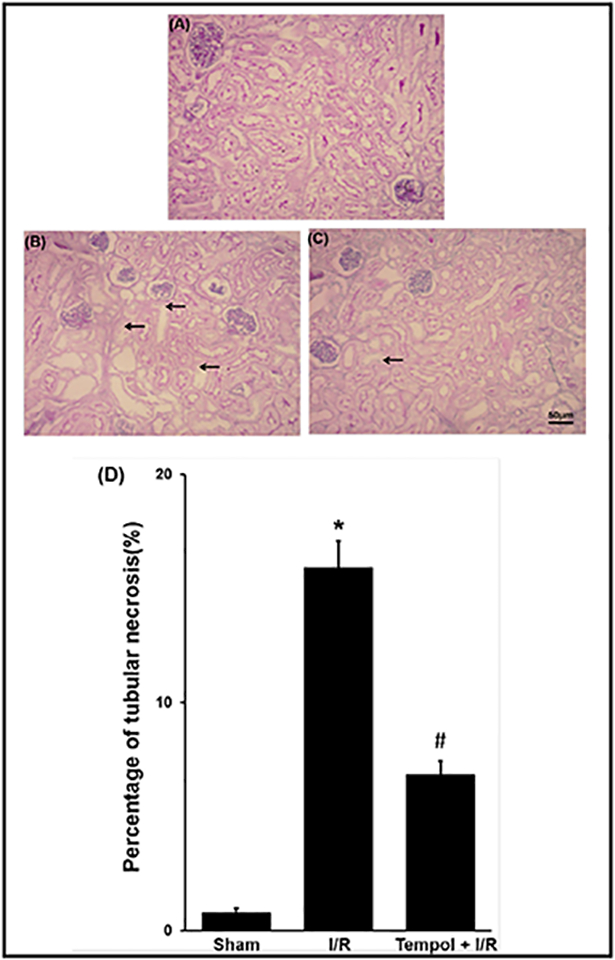
Fig. 4.

Effect of tempol on the morphologic changes of kidney tissues. PAS staining kidney sections were taken from sham group (A), I/R group (B) and I/R pretreated with tempol (50 mg/kg, C) and kidney injury was quantitatively measured by percentage of tubular necrosis in the cortex (D). Data were expressed as mean ± SEM, n=3, * p<0.05 vs sham group, # p <0.05 vs I/R group.
