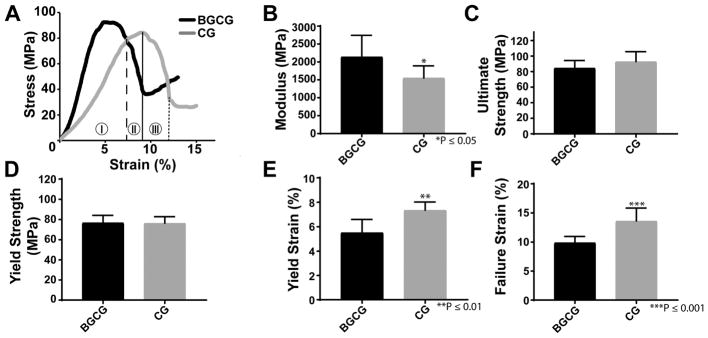
Figure 1.
Compression properties of the grafts cured for 24 hrs. (A) Representative stress-strain curve for the BGCG and CG groups. The vertical lines on the CG curve show points selected for yield (dashed), ultimate strength (solid), and failure (dotted) and indicate 3 zones in which the compressive properties can be analyzed: (I) elastic zone, (II) post-yield zone, and (III) fracture zone. (B) Modulus, (C) ultimate strength, (D) yield strength, (E) yield strain, and (F) failure strain were measured from the stress-strain curves. Error bars represent standard deviation. **p < 0.01, ***p<0.001.

