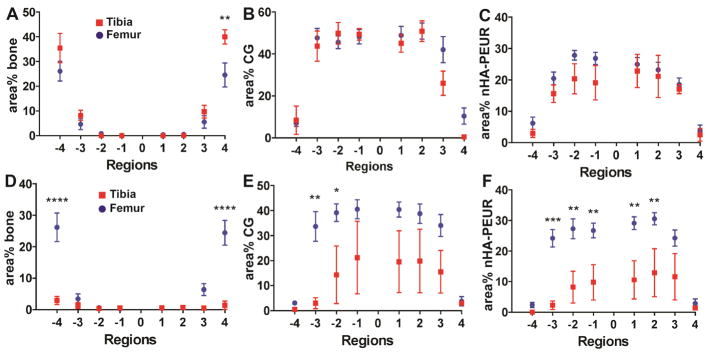
Figure 9.
Histomorphometric comparison of new bone formation and graft resorption between the tibial plateau and femoral condyle defects. (A) area% bone for the CG group, (B) area% CG for the CG group, (C) area% nHA-PEUR for the CG group, (D) area% bone for the BGCG group, (E) area% CG for the BGCG group, (F) area% nHA-PEUR for the BGCG group. Error bars represent SEM. Significant differences: * p < 0.05, ** p < 0.01, *** p < 0.005, **** p < 0.001.

