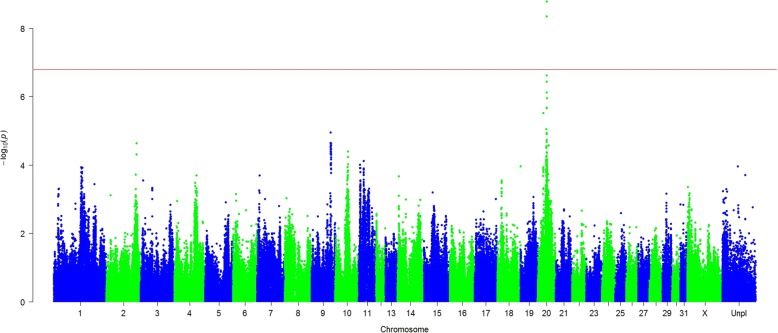
Fig. 1.
Manhattan plot of insect bite hypersensitivity in Friesian horses based on a SNP-based genome-wide association study. Significance level based on allele frequency differences between cases (n = 141) and controls (n = 135) using a χ2-test (1df). The horizontal red line is the Bonferroni corrected significance level (P-value = 1.63 × 10⁻⁷)

