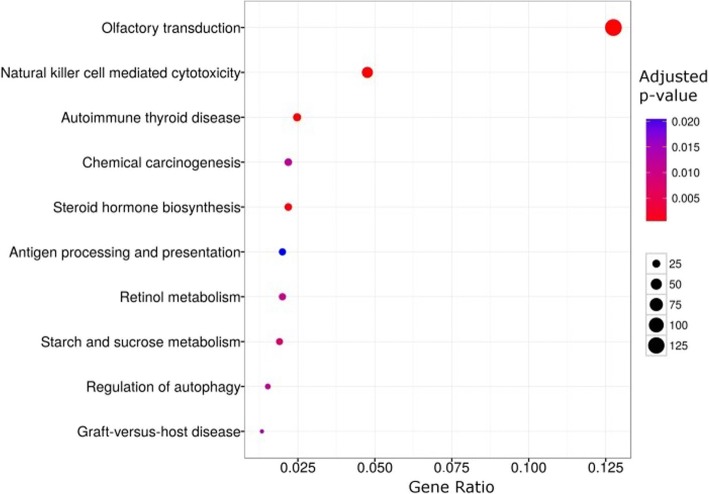
Fig. 3.
Biological pathways enriched in CNVRs detected in Friesian horses. Biological pathways enriched in CNVRs detected in 222 Friesian horses. To compose the gene enrichment, we used human orthologues (Ensembl – BioMart, [41]) of genes overlapping CNVRs. The y-axis indicates the enriched KEGG pathway. The x-axis the ratio between the number of analysed genes and the number of genes in each KEGG pathway presented on the y-axis. The ‘Adjusted p-value’ heatmap represents the enrichment P-value for each pathway corrected for false discovery rate (FDR, [60]). The circle size represents the number of genes in each pathway

