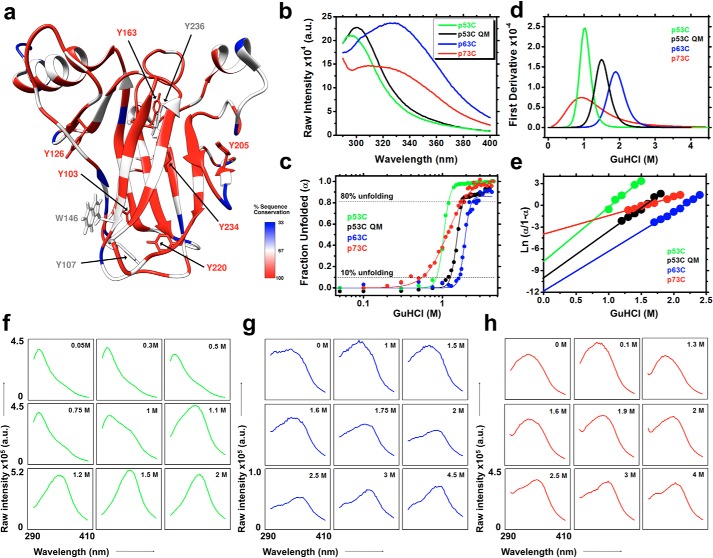
Figure 2.
a, percentage of sequence conservation among the p53 family members (p53C, p63C, and p73C) is depicted as a color code in the p53 core domain structure (Protein Data Bank code 2FEJ). Tyr residues and the single Trp are shown as sticks. b and c, fluorescence emission spectra recorded upon excitation at 280 nm and the fraction unfolded plotted against GuHCl for the p53C family members. d, first derivative plots used to extract the GuHCl concentration at the midpoint of the transitions (G50%). e, ΔG0 MF-U values were obtained from the intercepts of the linear regression of the transition points multiplied by the temperature and the universal gas constant. f–h, raw fluorescence spectra at different GuHCl concentrations for p53C (f), p63C (g), and p73C (h). GuHCl concentrations were chosen according to their fraction unfolded plots (c) to better represent the spectroscopic events discussed in this work. The scales in the bottom left graphs are the same for each construct, unless otherwise stated.

