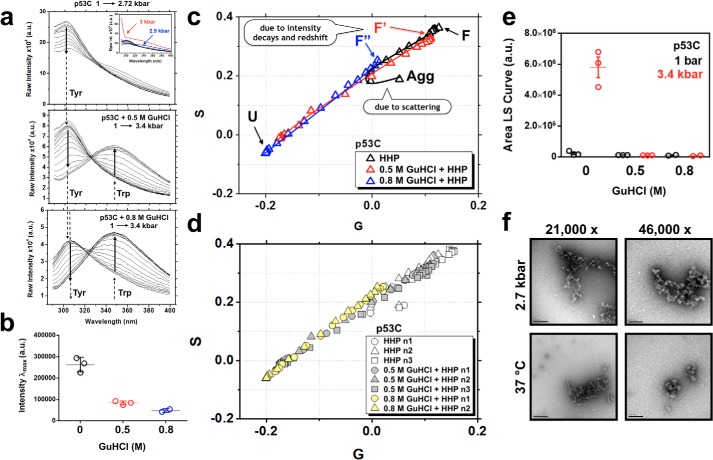
Figure 4.
a, fluorescence emission data sets for p53C upon excitation at 280 nm showing HHP titrations in 0 m (top), 0.5 m (middle), and 0.8 m (bottom) GuHCl. The Tyr and Trp contributions are labeled. Note the slight red shift in the Tyr signal upon incubation with GuHCl at the above concentrations. The inset shows in blue and red the scattering contribution at pressures higher than 2.7 kbar. b, scatter plot of the maximum peak intensities of p53C in the absence (black) and presence of 0.5 (red) and 0.8 m GuHCl (blue) at atmospheric pressure. c, phasor plots of the data sets described in a, highlighting the population-weighted average states of folded (F), folded containing MG-like properties (F′ and F″), and unfolded (U) at increasing GuHCl concentrations. Pressures higher than 2.7 kbar shift the p53C energetic landscape to a dead-end aggregation route (Agg), which is characterized by an inflection in the phasor plot. d, different data sets were obtained in the absence or in the presence of 0.5 or 0.8 m GuHCl for p53C to confirm the robustness of the measurements. e, scatter plots of the area under the LS curve at 1 and 3.4 kbar for the data sets described in a. f, negatively stained micrographs showing the morphology of the dead-end aggregation route of p53C after incubation at 2.7 kbar for 2 h or at 37 °C. a.u., arbitrary units.

