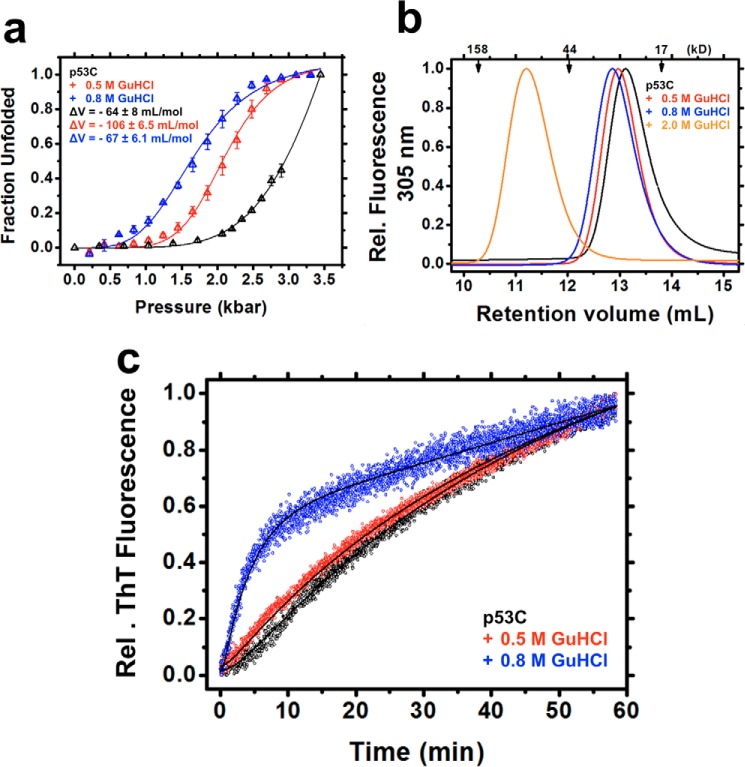
Figure 6.
a, fraction unfolded plotted against pressure based on titration in the absence or presence of 0.5 or 0.8 m GuHCl. For the ΔV calculations, see “Experimental procedures.” b, size-exclusion chromatography recorded at a fluorescence emission of 305 nm upon excitation at 280 nm. c, thioflavin T kinetics obtained for the competent pre-amyloidogenic states within the population-weighted average of p53C states in the absence and presence of 0.5 or 0.8 m GuHCl at 37 °C. The curve fits (see Equation 42) are represented as black lines.

