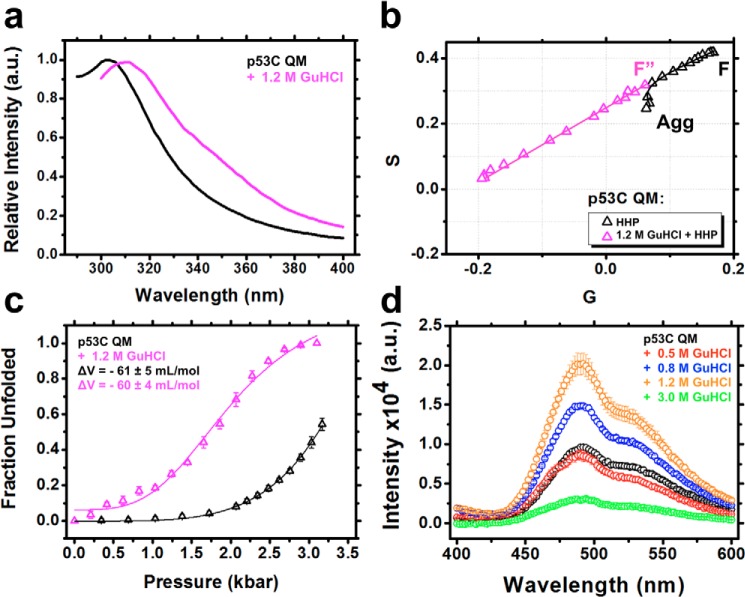
Figure 7.
a, normalized fluorescence emission spectrum of p53C QM in the absence or in the presence of 1.2 m GuHCl. b, phasor plot of p53C QM from the hydrostatic pressure titration data sets in the absence or in the presence of 1.2 m GuHCl. F″, the population-weighted average states containing competent MG pre-amyloidogenic conformers. Even p53C QM shifts to a dead-end aggregation route (Agg) at pressures higher than 3.2 kbar. c, fraction unfolded against pressure titration in the absence or presence of 1.2 m GuHCl. d, fluorescence emission spectra of bis-ANS bound to p53C QM in the absence or presence of different GuHCl concentrations. a.u., arbitrary units.

