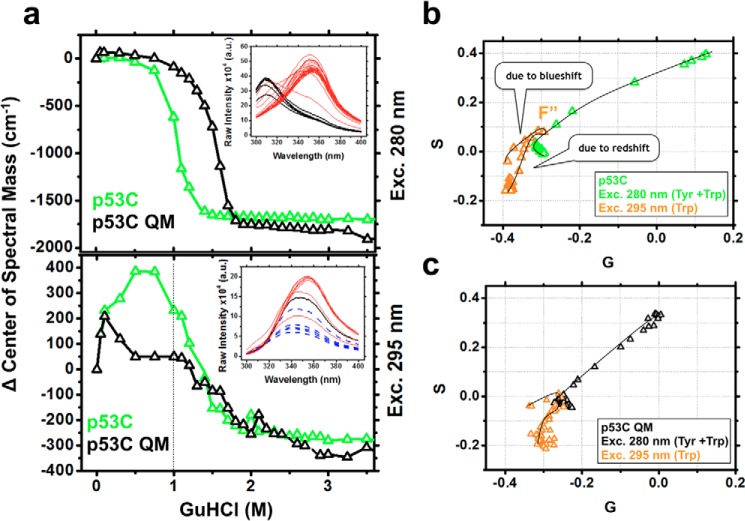
Figure 8.
a, changes in the center of spectral mass as a function of the GuHCl concentration showing the contribution of Tyr + Trp (top) and Trp (bottom) for p53C and p53C QM. Note an increase at 400 cm−1 in the range of 0–1 m GuHCl for p53C. Insets, p53C raw emission data. Black and red curves, pre- and post-transition spectra. Blue dashed lines, blue shift of the Trp in the reported range before exposure to the solvent. b and c, phasor plots for p53C and p53C QM, respectively, highlighting the conformational changes of the single Trp (F″) within the population-weighted average states, as observed from the deviation in the linearity of the plots. G and S, first harmonic Fourier transformation of the spectral axis wavelength and intensity, respectively.

