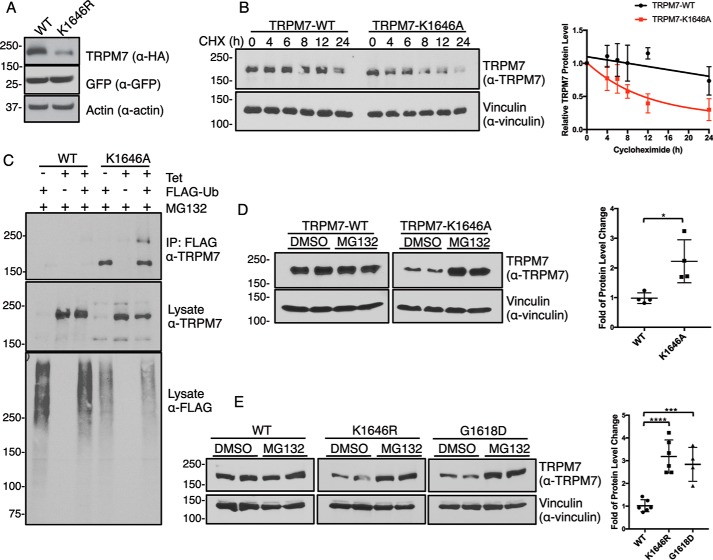
Figure 1.
Inactivation of TRPM7 kinase increases channel turnover. A, HA–TRPM7–WT (WT) and a kinase-inactive mutant TRPM7–K1646R (K1646R) were transiently expressed with GFP in HEK-293T cells for 24 h. SDS–PAGE and Western blotting demonstrated reduced protein expression of TRPM7–K1646R compared with the WT channel. GFP and actin served as transfection and loading controls, respectively. B, HEK-293 cells stably expressing HA–TRPM7–WT and HA–TRPM7–K1646A were induced with tetracycline for 24 h and replaced with fresh medium containing 10 μg/ml CHX to arrest protein synthesis. Cell lysates were harvested at various time points after CHX treatment. Equal amounts of total proteins were analyzed by SDS–PAGE and Western blotting. The relative TRPM7 levels were calculated by normalizing TRPM7 protein levels against the vinculin control in each sample. Time courses for TRPM7–WT and TRPM7–K1646A protein turnover are shown on the right (n = 3, means ± S.D.). C, HEK-293 cells stably expressing HA–TRPM7–WT and HA–TRPM7–K1646A were induced with tetracycline (Tet) and co-transfected with FLAG–ubiquitin (FLAG-Ub) for 24 h. Cell lysates were immunoprecipitated with anti-FLAG–agarose. TRPM7 and ubiquitinated proteins in FLAG–IP and lysates were probed by an anti-TRPM7 and anti-FLAG antibody, respectively. D, HEK-293 cells stably expressing HA–TRPM7–WT or TRPM7–K1646A were induced with tetracycline for 24 h and then replaced with fresh medium containing DMSO or MG132 (1 μm) for 24 h. Equal amounts of cell lysates were resolved by SDS–PAGE and Western blotting. The fold of TRPM7 protein level change was calculated by dividing relative TRPM7 protein levels (TRPM7/vinculin) in each MG132-treated sample against DMSO-treated controls. Replicates (n = 4) from two independent experiments were analyzed (means ± S.D.). *, p = 0.0158. E, HEK-293T cells transiently expressing HA–TRPM7–WT, HA–TRPM7–K1646R, and HA–TRPM7–G1618D were treated with DMSO or MG132 (1 μm) for 24 h. Equal amounts of cell lysates were resolved by SDS–PAGE and Western blotting. Protein quantification was performed as described above. Replicates (n = 4–6) from three independent experiments were analyzed (means ± S.D.). ****, p = 0.0001; ***, p = 0.0008.

