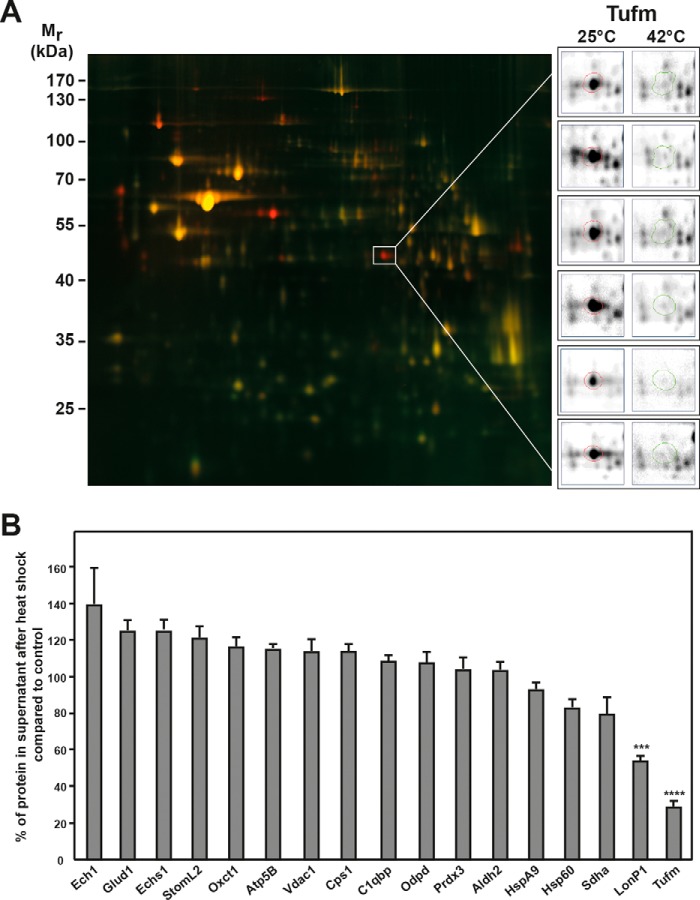
Figure 2.
Proteomic analysis of the mitochondrial proteome under heat stress. A, 2D DIGE spot pattern of heat-treated mitochondria. Gel shows an overlay of total soluble protein samples from control (25 °C; red) and heat-treated (20 min at 42 °C; green) mitochondria. The gel shown is a representative example of three experiments. Protein spots of the mitochondrial elongation factor Tu (Tufm) are shown enlarged for all six gels analyzed (right panels). Mr, relative molecular mass. B, quantification of selected protein spots. Shown are relative differences of spot intensities between control and heat-stressed mitochondria. Average spot intensities in control samples were set to 100%. Spot detection and quantification were done using the Delta2D software (DECODON). Error bars indicate the S.E. The significance was calculated via one-way analysis of variance using the Dunnett's multiple comparisons test. A p value of ≤0.001 was considered significant and is indicated by asterisks.

