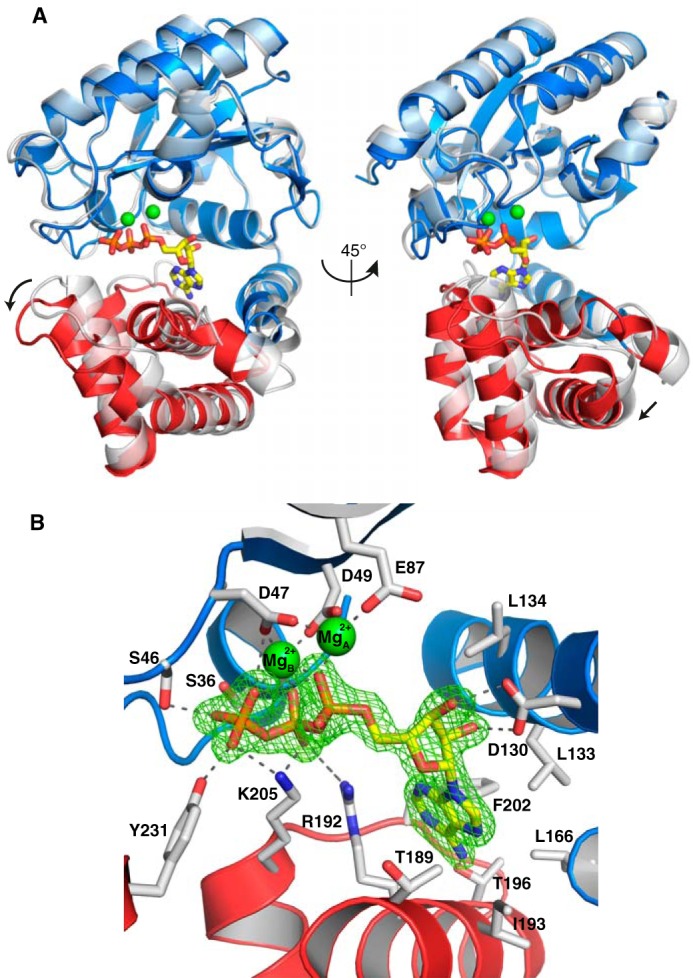
Figure 2.

Structure of AadA in complex with ATP and magnesium. A, binding of ATP (yellow) and two magnesium ions (green) triggers a shift compared with the apo structure (transparent gray), indicated by an arrow, of the main part of the C-terminal domain (red) relative to the N-terminal domain and helix 7 (blue). B, detailed interactions of AadA with ATP (yellow) and magnesium ions (green). Direct hydrogen bonds between protein and ligands are shown as dashed lines, and the Fo − Fc omit map for ATP, contoured at 5 σ, is shown as green mesh.
