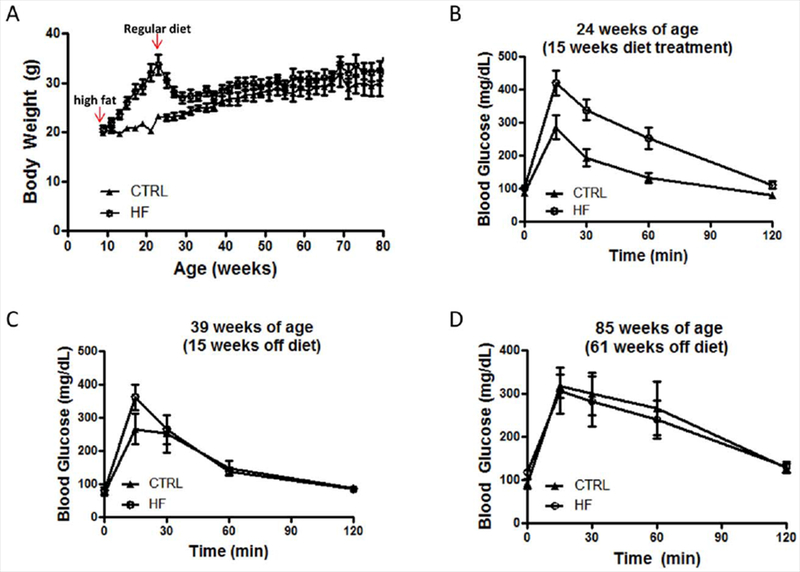
Figure 2.

Body weight and glucose tolerance test in HF and CTRL C57BL/6J mice. A: Body weight record: arrows indicate the initiation and the end of high-fat diet treatment. B–D: Intraperitoneal glucose tolerance test following 15 weeks of high-fat diet treatment (B), 15 weeks off of the high-fat diet (C), and 61 weeks off of the high-fat diet (D; n = 7–8 per group). [Color figure can be viewed in the online issue, which is available at wileyonlinelibrary.com.]
