Figure 5.

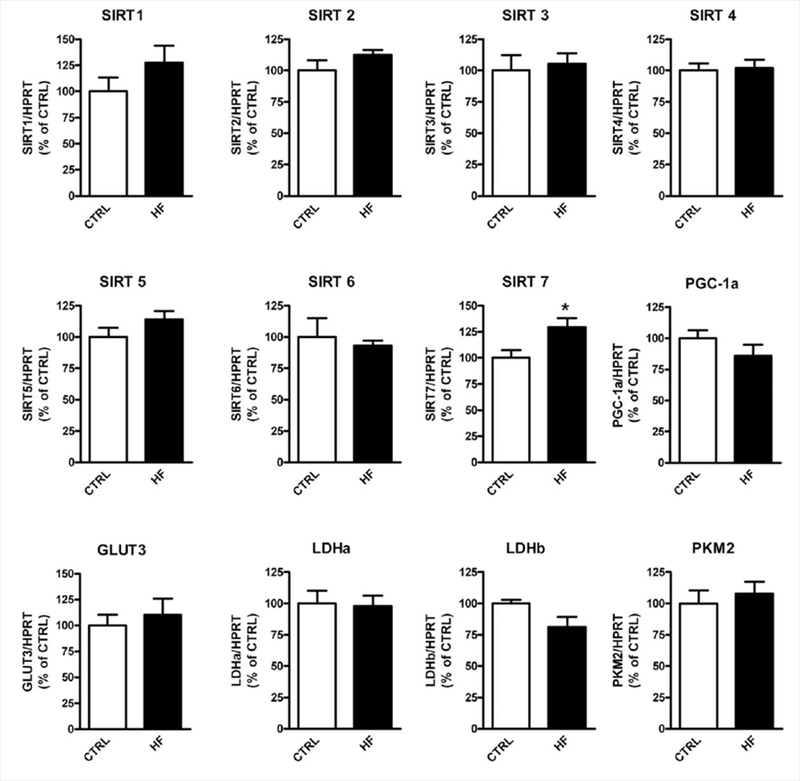
Expression of select mitochondria/energy metabolism-related genes in the brains of HF mice compared with CTRL mice. Messenger RNA expression of select genes in the brain was measured by real-time PCR. *P < 0.05 (n = 6–7 per group).

Expression of select mitochondria/energy metabolism-related genes in the brains of HF mice compared with CTRL mice. Messenger RNA expression of select genes in the brain was measured by real-time PCR. *P < 0.05 (n = 6–7 per group).