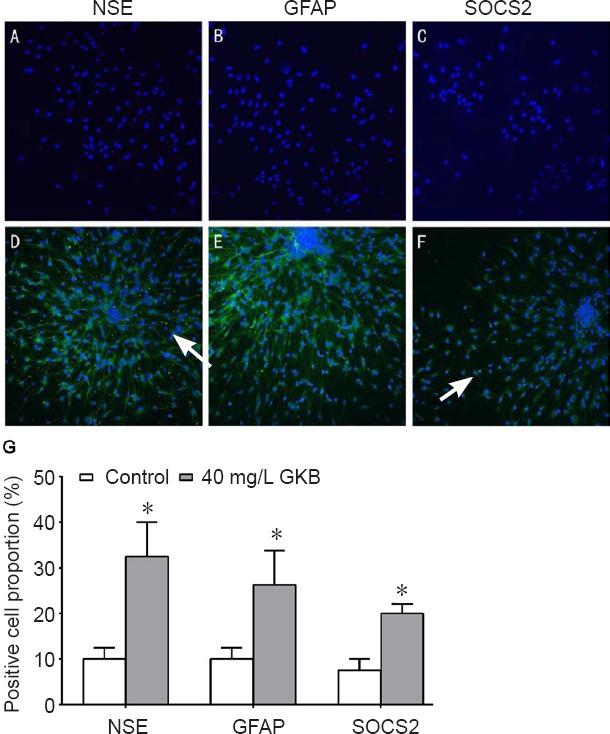
Figure 2.

Effect of ginkgolide B (GKB) on differentiation of neural stem cells.
(A–F) Expression of neuron-specific enolase (NSE), glial fibrillary acid protein (GFAP) and suppressor of cytokine signaling 2 (SOCS2) in neural stem cells in the control group (A–C) and the 40 mg/L GKB group (D–F) after induced differentiation for 7 days. The blue color represents cell bodies, and the green color represents processes. Arrows indicate NSE-, GFAP- or SOCS2-positive cells. (G) Percentage of NSE-, GFAP- and SOCS2-positive cells after 7 days of induced differentiation. Data are presented as the mean ± SD (n = 3 per group; independent t-test). *P < 0.05, vs. control group.
