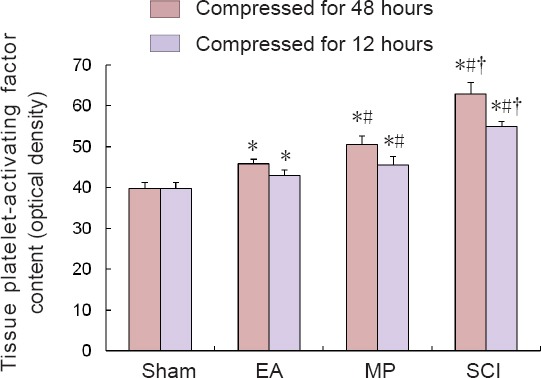
Figure 3.

Comparison of tissue platelet-activating factor content in the groups compressed for 12 and 48 hours.
All data are expressed as the mean ± SD (n = 6 per group). *P < 0.05, vs. sham group; #P < 0.05, vs. EA group; †P < 0.05, vs. MP group (one-way analysis of variance followed by the least significant difference post hoc test). EA: Electroacupuncture; MP: methylprednisolone; SCI: spinal cord injury.
