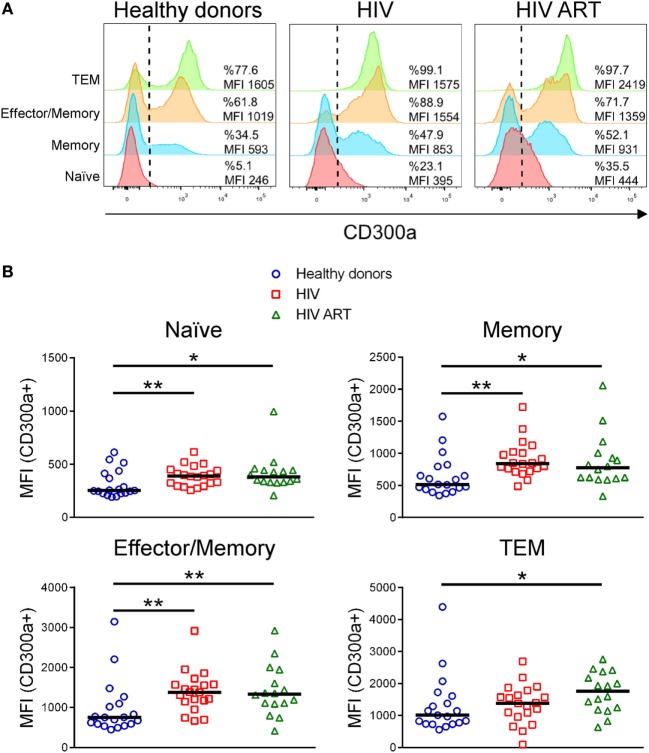
Figure 1.
CD300a inhibitory receptor expression on CD4+ T cell subsets from healthy donors and human immunodeficiency virus (HIV)-1 infected patients. (A) Representative histograms showing the percentage of CD300a+ cells and the median fluorescence intensity (MFI) of CD300a within positive cells on CD4+ T cell subpopulations. Data from a representative healthy donor, a cART naïve (HIV) and a patient on cART (HIV ART) are shown. (B) Dot plots showing the MFI of CD300a within positive cells on CD4+ T cell subsets from healthy donors and cART naïve (HIV) and cART-treated (HIV ART) HIV-1-infected patients. Each dot represents a subject and the median is shown. *p < 0.05, **p < 0.01.

