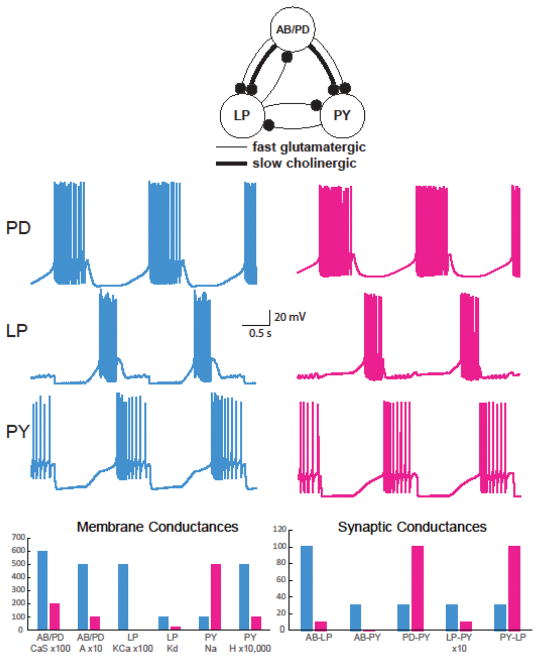
Figure 1.
Different instances of the Pyloric Model Generate Very Similar Activity Patterns using Widely Differing Cellular and Synaptic Properties. Top: schematic of a simplified version of the modeled pyloric circuit (black balls: inhibitory synapses). The PD and AB neurons are electrically coupled (not shown). Middle: Voltage traces from two pyloric network model instances (cyan and magenta). Bottom: Selected membrane and synaptic conductances of the network model instances (cyan and magenta) shown above. Data replotted and adapted from [9]9.

