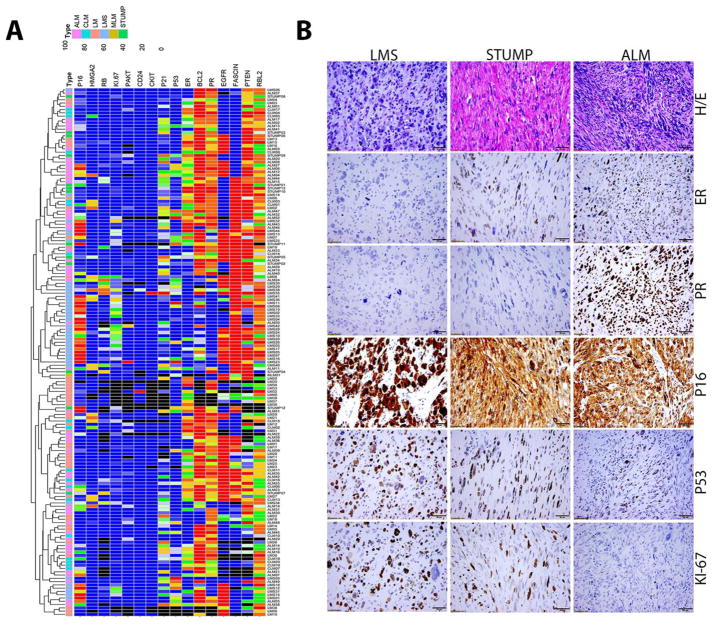
Figure 2.
A. Dendragram treeview illustrate the unsupervised cluster analysis for expression levels of 17 selected biomarkers detected in 166 cases from five different subtypes of uterine smooth muscle tumors. Scale bars (blue=0, red=100) indicate the immunopercentage for each markers. Color coding for tumor: ALM=pink, CLM=blue, LMS=light blue, ULM=orange, STUMP=green, and black=no data available. B. Photomicrographs (40X) illustrating H&E and immunohistochemical staining for the five markers ER, PR, p53, p16, and Ki-67 in LMS, STUMP and ALM/LM-BN.

