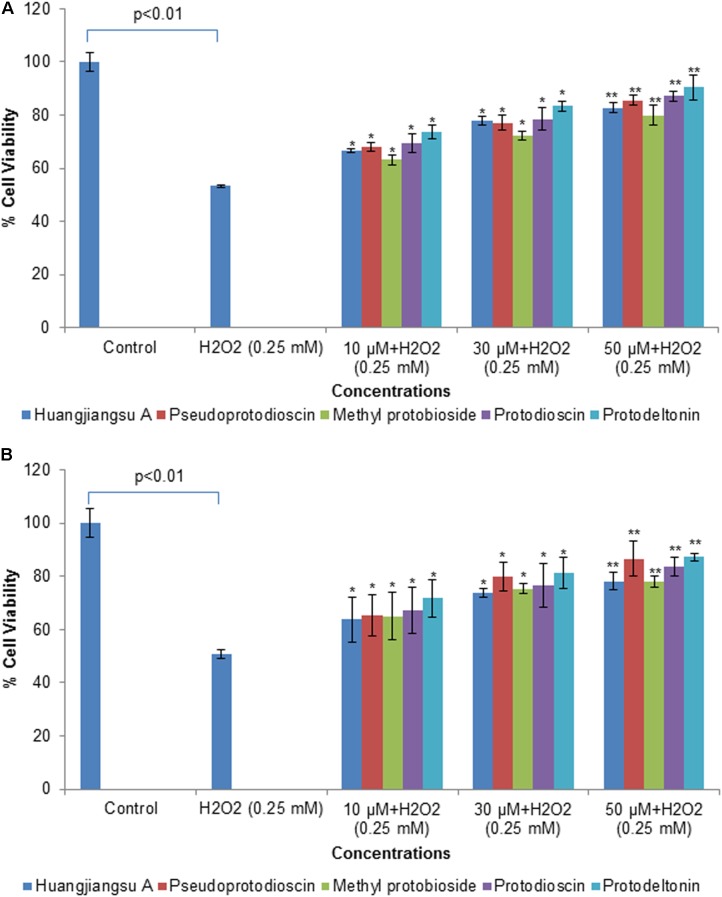
FIGURE 5.
Assessment of protective potential of compounds on cell viability of HepG2 cells by (A) MTT assay and (B) NRU assay. Cells were exposed to 10, 30, and 50 μM of non-cytotoxic compounds for 24 h. Then the cells were exposed to H2O2 at 0.25 mM for 24 h. All values are given as mean ± SD. ∗p < 0.05, ∗∗p < 0.01 versus H2O2.

