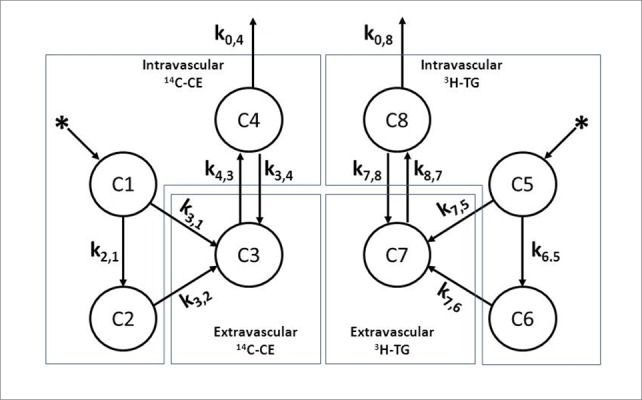
Figure 1. Kinetic model employed for chylomicron-like emulsion metabolism in vivo.

The observed data (compartments C1 and C2) present a biexponential curve. Compartments C1- C4 represent kinetics of 14C-cholesteryl oleate (14C-CE). Compartments C5 - C8 represent kinetics of 3H-triglycerides (3H-TG). Compartments C1 and C5 represent emulsion after plasma injection. Compartments C2 and C6 represent emulsion after redistribution. Compartments C3 and C7 correspond extra-vascular space, mainly the liver, and C4 and C8 the emulsion labeled lipids recirculation. The constants ki,j (min-1) represent the fractional catabolic rate (FCR) or transfer from compartment j to compartment i over time. k3,1 and k7,5 - fraction of injected emulsion that is removed directly from plasma by the liver and other tissues. k2,1 and k6,5 - emulsion transfer rates to a complex plasma lipoprotein pool. k3,2 and k7,6 - removal from the plasma of the emulsion mainly by the liver. k4,3 and k 8,7 - emulsion transfer rates to VLDL (labeled lipids recirculation). k3,4 and k7,8 - recirculated lipids removal by the liver. k0,4 and k0,8 - output of labeled lipids from the body.
