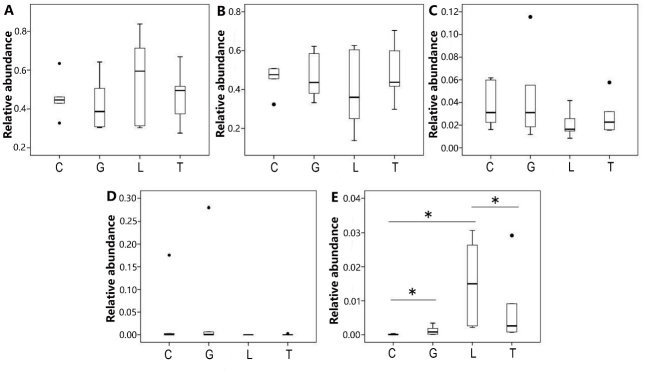
Figure 3. Comparison relative abundance of microbiota at the phylum level among the 4 groups.
Relative abundance (at the phylum level) of Bacteroidetes (A), Firmicutes (B), Proteobacteria (C), Verrucomicrobia (D), and Spirochaetae (E) among the 4 groups. C denotes group C; G denotes group G; L denotes group L; T denotes group T; * denotes P<0.05.

