
Figure 8. Effects of CAPE (10 mg/kg) on GSK3 phosphorylation (pGSK3) after Aβ1-42O injection.
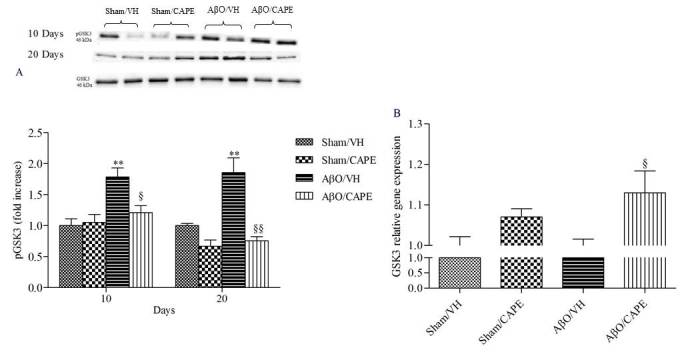
pGSK3 was determined 10 and 20 days after Aβ1-42O injection by Western Blotting at 46kDa using total GSK3 as loading control (A). Top: representative images of the protein expression in hippocampus. Bottom: quantitative analysis of the Western Blotting results for the pGSK3 levels. The graphs show densitometry analysis of the bands appertaining to the protein of interest. Values are expressed as mean of fold increase ± SEM (n=10) of each group compared to the Sham/VH group. GSK3 mRNA relative expression (B) was determined in hippocampal samples 10 days after Aβ1-42O injection through the 2-ΔΔCt method. Rn 18S and ACTB were used as control housekeeping genes. Values are presented as mean ± SEM of at least four different experiments (A: **p<0.01 vs. sham groups, §p<0.05 and §§p<0.01 vs. AβO/VH group; B: §p<0.05 vs. AβO/VH group; ANOVA, post hoc test Bonferroni).