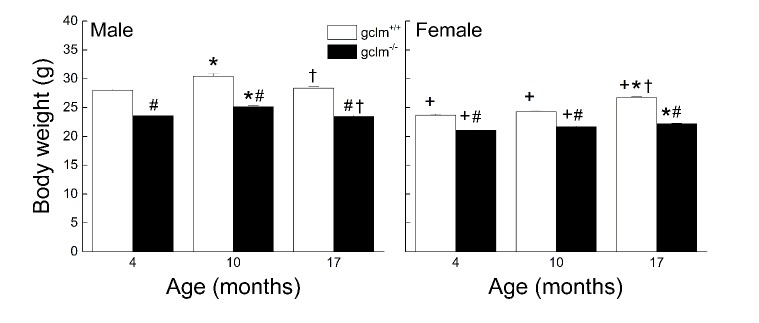
Figure 1. Effects of age, sex and genotype on body weights (g) in young (4 month), adult (10 month), and old (17 month) gclm+/+ and gclm-/- mice.
Each value represents the mean + SEM. + p<0.05 compared to age and genotype-matched males; *p < 0.05 compared to genotype-matched young; †p<0.05 adult compared to genotype-matched old; #p < 0.05 compared to age-matched gclm+/+.

