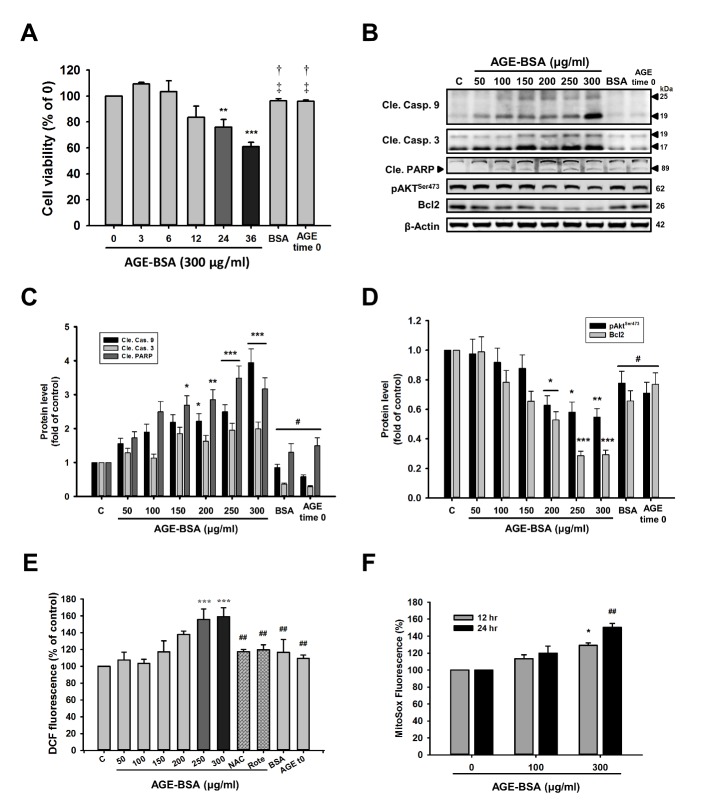
Figure 1. AGE-BSA reduces cell viability, enhanced apoptosis and ROS generation in H9c2 cells in a time- and dose-dependent manner.
(A) Cells were treated with 300 μg/ml of AGE-BSA for different time periods as indicated or non-glycated BSA. Cell viability was determined using MTT assays. (B) Cells were treated with AGE-BSA at different concentrations as indicated. Levels of apoptosis-related proteins were analyzed by western blotting. These are cropped blots; full-length blots are presented in Suppl. Figure S1. (C, D) Bar graphs show relative optical densities of the (fig. 1B) apoptosis and survival protein levels at 24 h. (E) Intracellular ROS levels of fluorescence intensities of DCF and (F) the mitochondrial ROS levels of AGE-BSA-exposed cardiac cells at the indicated doses and time periods were examined by flow cytometry. NAC (500 μM); rotenone (Rote) (0.1 μM). Bars indicate the mean ± SEM obtained from experiments performed in triplicate. *P<0.05, **P <0.01 and ***P<0.001 compared with the control group; #P<0.05 and ##P<0.01compared with the 300 μg/mg group; †P<0.05 when compared with 24 h or 36 h.

