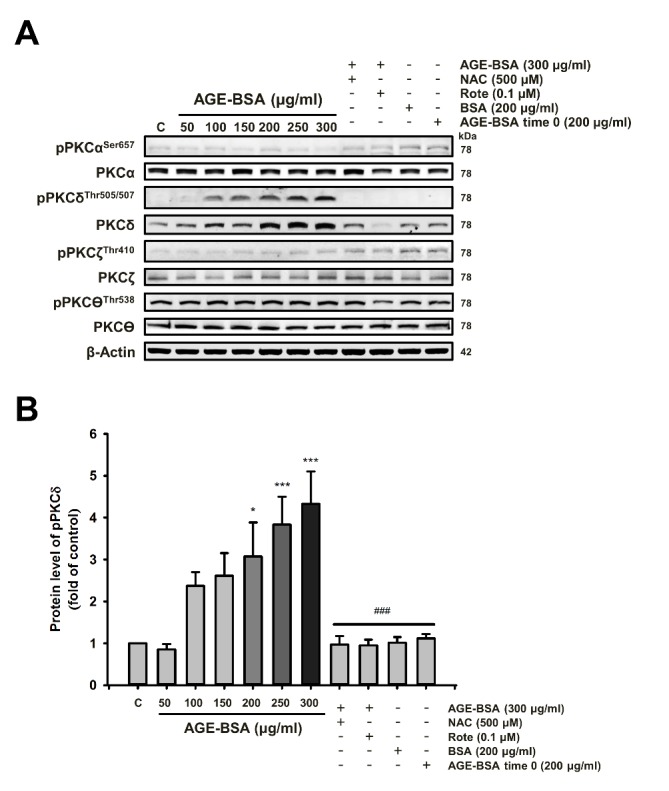
Figure 2. Among PKC isoforms, AGE-BSA specifically induces PKCδ protein expression and phosphorylation in cardiac cells.

(A) Cells were treated with different doses of AGE-BSA with or without ROS scavengers (NAC) and mitochondrial complex I inhibitor (Rote) as indicated for 24 h. Western blot analyses were performed with antibodies against the PKC isoforms. These are cropped blots; full-length blots are presented in Suppl. Figure S2. (B) The densitometry measurements show the quantitative results of the western blots. Bars indicate the mean ± SEM obtained from experiments performed in triplicate. *P<0.05 and ***P<0.001 compared with the control group; ###P<0.001 compared with the AGE-BSA (300 μg/ml) group.
