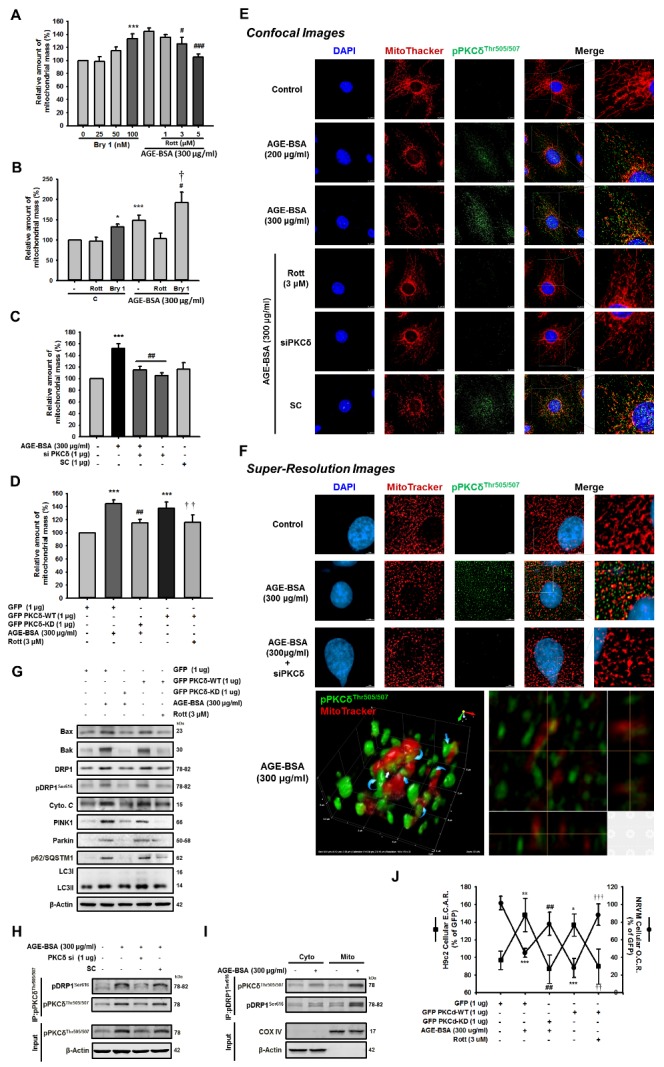
Figure 6. AGE-BSA-induced mitochondria damage and decreased biological function is through PKCδ activation and colocalization in cardiac cells.

(A, B) Cells were treated with the PKCδ activator, bryostatin 1 (100 nM) or inhibitor, rottlerin, (3 μM) for 24 h following exposure to AGE-BSA (300 μg/ml). (C) AGE-BSA-exposed cells were transfected with PKCδ siRNA (1 μg) for 24 h. (D) Cells were transfected with GFP-PKCδ-WT plus rottlerin or AGE-BSA-exposed cells were transfected with GFP-PKCδ-KD. Mitochondrial damage was evaluated by mitochondrial mass, which was analyzed by flow cytometry. (E) AGE-BSA-treated cells were administered the inhibitor rottlerin (3 μM) or siPKCδ for 24 h. The mitochondrial fission and colocalization with PKCδ were examined by immune-fluorescence and analyzed by confocal microscopy. (F) Super resolution images of mitochondria structure in cells were analyzed with similar experimental procedures. Blue, DAPI (4, 6-diamidino-2-phenylindole)-stained nuclei; red, MitoTracker Red CMXRos-stained mitochondria. (G) The levels of proteins associated with mitochondrial fission and mitophagy in cells were analyzed with similar experimental procedure. These are cropped blots; full-length blots are presented in Suppl. Figure S6. Neonatal rat ventricular myocyte (NRVM) and H9c2 were then analyzed for (H) Cells were treated with AGE-BSA for 24?hr and then transfected with the PKCδ siRNA (1 μg) for 24?hr. Cell lysates were immunoprecipitated using antibodies against pPKCδT505/507. Protein expression was detected by immunoblotting. (I) The cytosolic and mitochondrial fractions were isolated and subjected to immunoprecipitation followed by western blot analysis. These are cropped blots; full-length blots are presented in Suppl. Figure S7. (J) Cellular oxygen consumption rate (O.C.R) and extracellular acidification (E.C.A.R) using an XF24 bioenergetics assay (Seahorse Bioscience, Billerica, MA). Data are expressed as the mean ± SEM, n=3. *P<0.05, **P<0.01, ***P<0.001 compared with the control or GFP group, #P<0.05, ##P<0.01, ###P<0.001 compared with the AGE-BSA (300 μg/mg) group, †P<0.05 compared with the Bry1-treated group, ††P<0.01, †††P<0.001 compared with the GFP-PKCδ-WT overexpression group.
