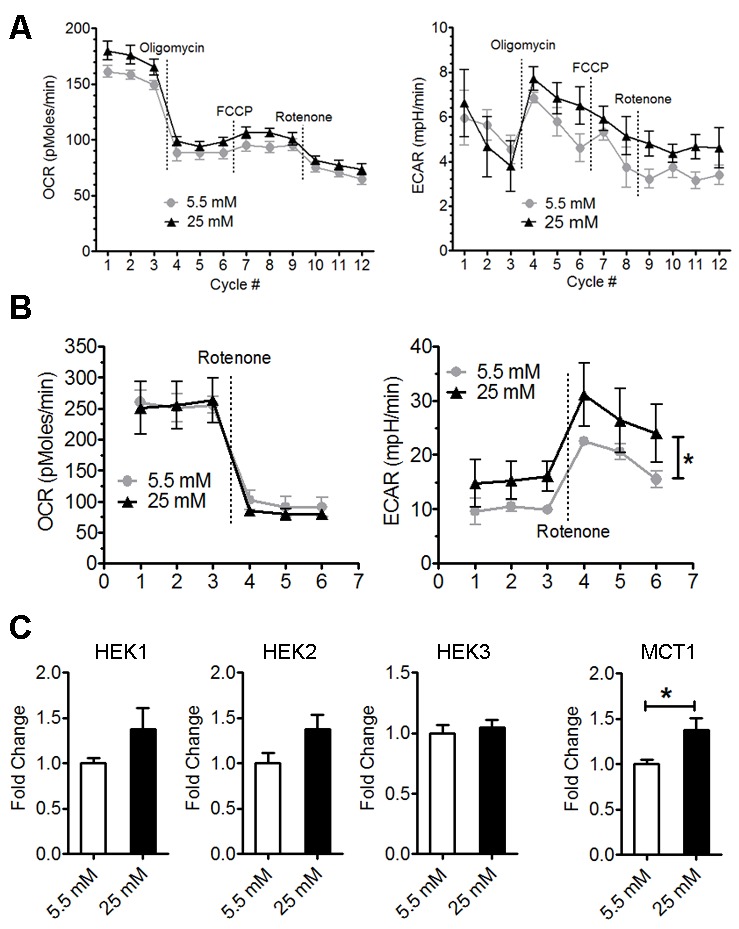
Figure 4. High glucose enhanced astrocyte glycolysis.

Seahorse extracellular flux analysis of oxygen consumption rate (OCR) and extracellular acidification rate (ECAR) after 6-hour (A) and 24-hour culture (B) in normal (5.5 mM) and high glucose (25 mM) (* p<0.05 vs 5.5 mM, n=5-6). C) Real-time rtPCR analysis of HEKs and MCT1 expression of astrocytes after 24-hour culture in normal (5.5 mM) and high glucose (25 mM) (* p<0.05 vs 5.5 mM, n=6-8).
