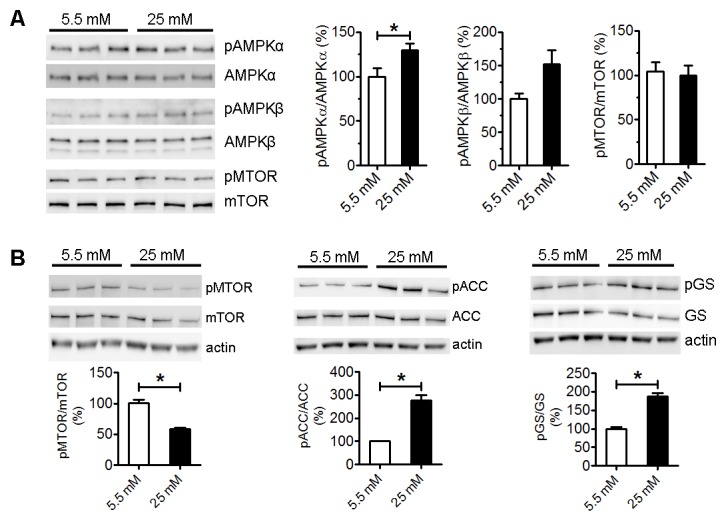
Figure 6. High glucose activated AMPK pathway.

A) Western blots and statistical analysis of AMPK and mTOR pathway in astrocytes after 4-day culture in normal (5.5 mM) and high glucose (25 mM) (*p<0.05 vs 5.5 mM, n=3). B) Western blot and statistical analysis of mTOR, ACC and GS activation after 2-week culture in normal (5.5 mM) and high glucose (25 mM) (*p<0.05 vs 5.5 mM, n=3).
