FIGURE 1.

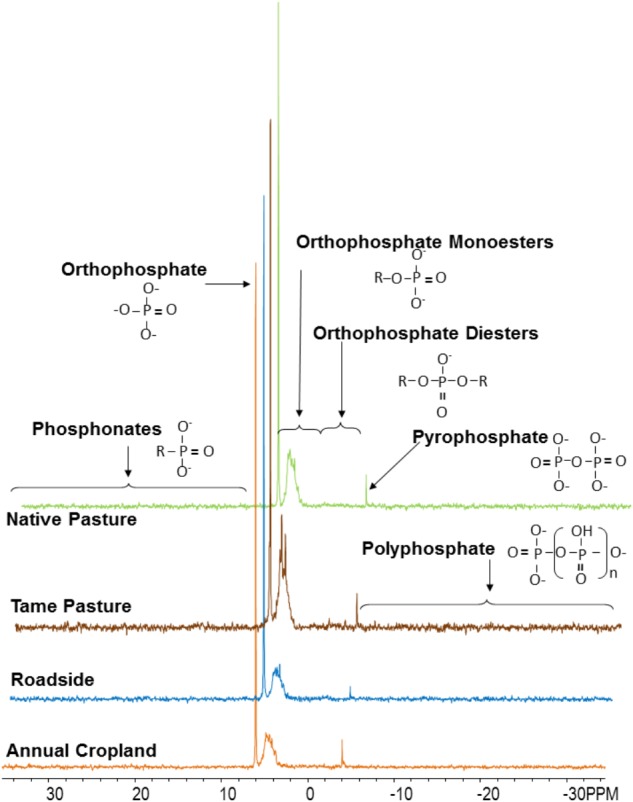
Spectra (P-NMR) for each land use type from the Masefield 1 location. Spectra were processed with 7 Hz line-broadening, and are plotted to full height and scaled to the height of the orthophosphate peak.

Spectra (P-NMR) for each land use type from the Masefield 1 location. Spectra were processed with 7 Hz line-broadening, and are plotted to full height and scaled to the height of the orthophosphate peak.