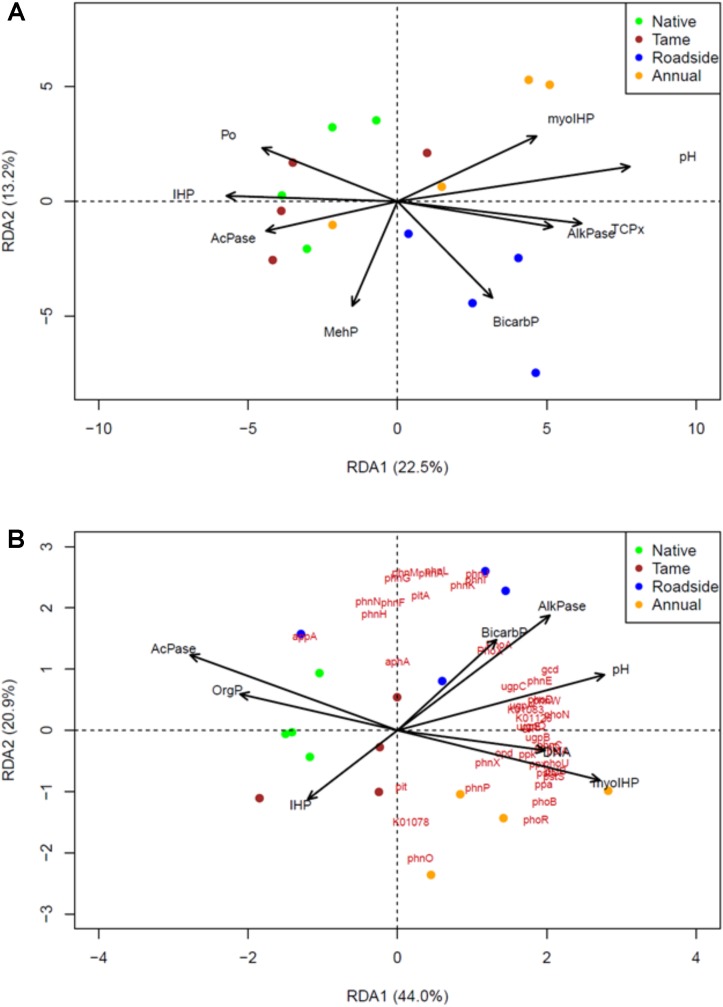
FIGURE 4.
Identification of the P chemistry related drivers of (A) the P-cycling soil bacterial community, and (B) soil P-cycling functional gene composition among the four land use types based on the metagenomic data sets and redundancy analysis (RDA). A step-wise selection of important predictors of gene and community composition was used in conjunction with the RDA. The biplot arrows represent the P-chemistry related variables and red text in (B) represent the P-cycling functional genes or KEGG orthology numbers. Green, brown, blue and yellow colors, respectively, represent native grasslands, tame grasslands, roadsides, and annual croplands.

