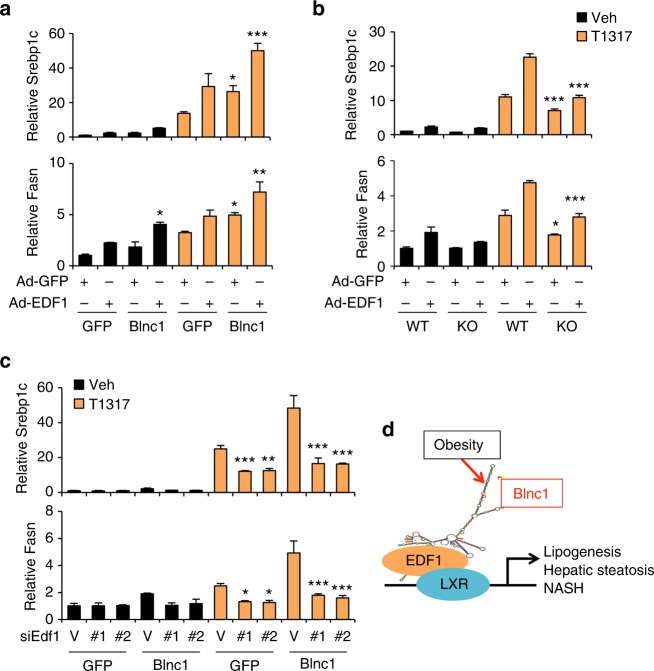
Fig. 10.
Role of EDF1 in lipogenic gene regulation. a qPCR gene expression analyses in hepatocytes transduced with recombinant adenoviruses as indicated. Data represent mean ± SD (n = 3). *p < 0.05, **p < 0.01, ***p < 0.001, GFP vs. Blnc1, two-way ANOVA. b Gene expression analysis in transduced WT or Blnc1 KO hepatocytes. Data represent mean ± SD (n = 3). *p < 0.05, ***p < 0.001, WT vs. KO, two-way ANOVA. c qPCR analysis of gene expression in transduced hepatocytes receiving control siRNA (V) or siRNAs targeting EDF1 (#1 and #2) followed by treatments with vehicle or 5 μM T1317 for 24 h. Data represent mean ± SD (n = 3). *p < 0.05, **p < 0.01, ***p < 0.001, vector vs. #1 or #2, two-way ANOVA. d A model depicting licensing of hepatic lipogenesis and NAFLD progression by the LXR/EDF1/Blnc1 ribonucleoprotein transcriptional complex

