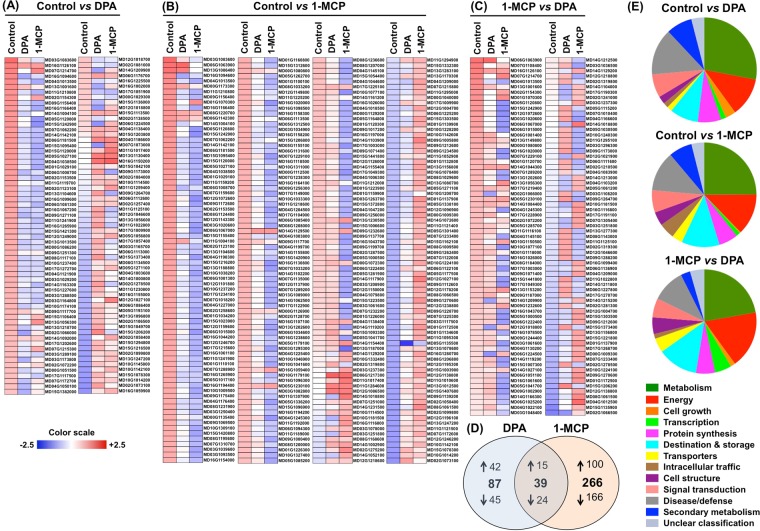
Figure 2.
Apple skin protein alternations due to DPA and 1-MCP treatments. The heat map depicts the relative level/abundance of each protein at cold storage for 3 months and subsequently transferred at 20 °C in order to characterize their ripening. (A) depicts the relative level/abundance of proteins Z-score fold change that significantly altered uniquely by DPA treatment compared to control, (B) depicts the relative level/abundance of proteins Z-score fold change that significantly altered uniquely by 1-MCP treatment compared to control, (C) depicts the relative level/abundance of proteins Z-score fold change that significantly altered by 1-MCP compared to DPA treatment, (D) Venn diagram which presents the total number of proteins that up- or down-accumulated by DPA and 1-MCP treatments compared to control and (Ε) functional classification of the identified proteins according to73. Z-score fold change values are shown on a color scale that is proportional to the abundance of each identified protein. Mean values of four independent determinations for each treatment were analyzed between the treatment and the control using the Perseus software. Details of each protein are summarized in Supplementary Table 1.

