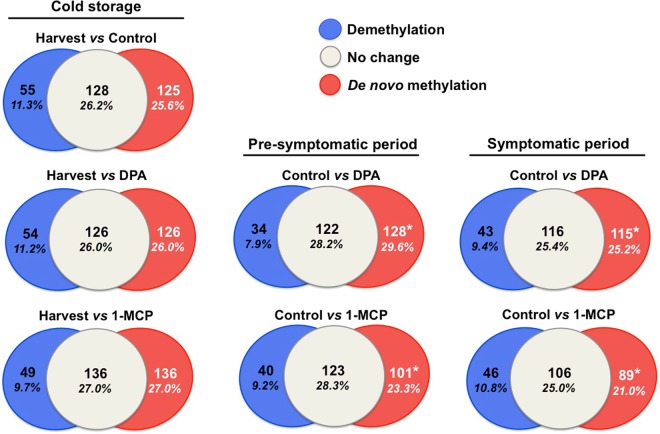
Figure 4.
Venn diagrams for global methylation based on relative levels at randomly sampled at 5′- CCGG -3′ sites with the MSAP marker in apple skin tissue (Supplementary Table 5). Methylation was analyzed at harvest, prior to scald visualization (pre-symptomatic period; 0 d at 20 °C), and during scald development (symptomatic period; 4 d at 20 °C). Additional experimental details as described in Fig. 1. The percentages of each methylation status (de novo methylation, demethylation and unchanged) from harvest, control and DPA/1-MCP treatments are also shown. Pooled samples from three independent skin tissues were analyzed for each (three) biological replicates. Data represent mean values from three technical replications for each biological sample. Values that significantly different (P < 0.05) from the harvest/control are marked with an asterisk (*).

