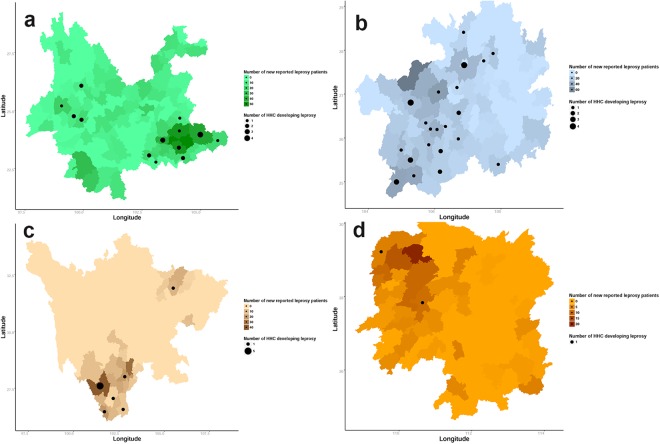
Figure 2.
Geographic distribution of new leprosy cases, including HHCs that developed leprosy, in southwest China between January 2010 and June 2014. In (a), Yunnan, (b) Guizhou, (c) Sichuan and (d) Hunan are highlighted with different colors to represent the number of new leprosy cases reported among these four provinces. The depths of colour represent the number of new leprosy patients. The location of each patient recorded, and HHC that developed leprosy, in the monitoring period in (a) Yunnan, (b) Guizhou, (c) Sichuan and (d) Hunan provinces are depicted by black dots, with the size of each dot representing the number of HHC that developed leprosy. The maps in this figure were generated by means of software R, including maptools, maps and mapdata (Version 3.3.3, https://cran.r-project.org/src/base/R-3/).

