Fig. 2.
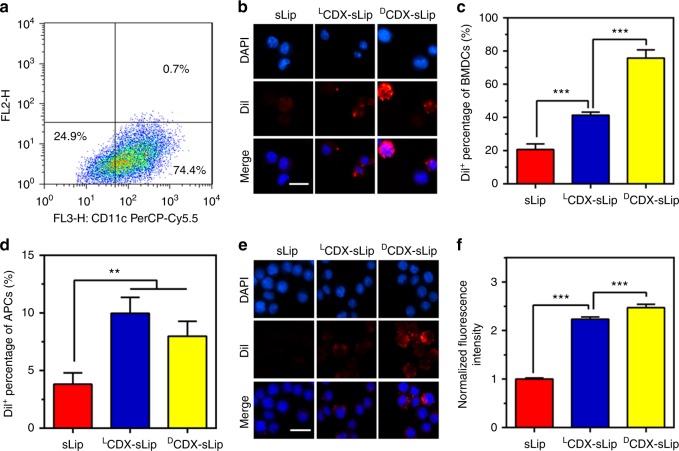
The uptake of sLip, LCDX-sLip, and DCDX-sLip by APCs. a The ratio of CD11c+ cells in BMDCs. BMDCs were stained with anti-CD11c antibody and counted by flow cytometry. b Microscopy observation of DiI+ BMDCs by confocal laser scanning microscopy. BMDCs were cultured with DiI-loaded liposomes for 4 h with serum and the nuclei were stained with DAPI. c The ratio of DiI+ BMDCs counted by flow cytometry. d The ratio of DiI+ cells in MHC II+ APCs. Lymph nodes were isolated 12 h post injection, then suspended in PBS. Cell suspension was incubated with anti-MHC II antibody at 4 °C for 1 h and the ratio of DiI+ cells in MHC II+ APCs was counted by flow cytometry. e Microscopy observation of DiI+ macrophages by confocal laser scanning microscopy. RAW264.7 cells were cultured with DiI-loaded liposomes for 1 h with serum and the nuclei were stained with DAPI. f The normalized fluorescence intensity in RAW264.7 cells by flow cytometry. Scale bar = 20 μm, n = 3, data are means ± s.d. Statistical significances were calculated by Student’s t-test. **p < 0.01, ***p < 0.001

