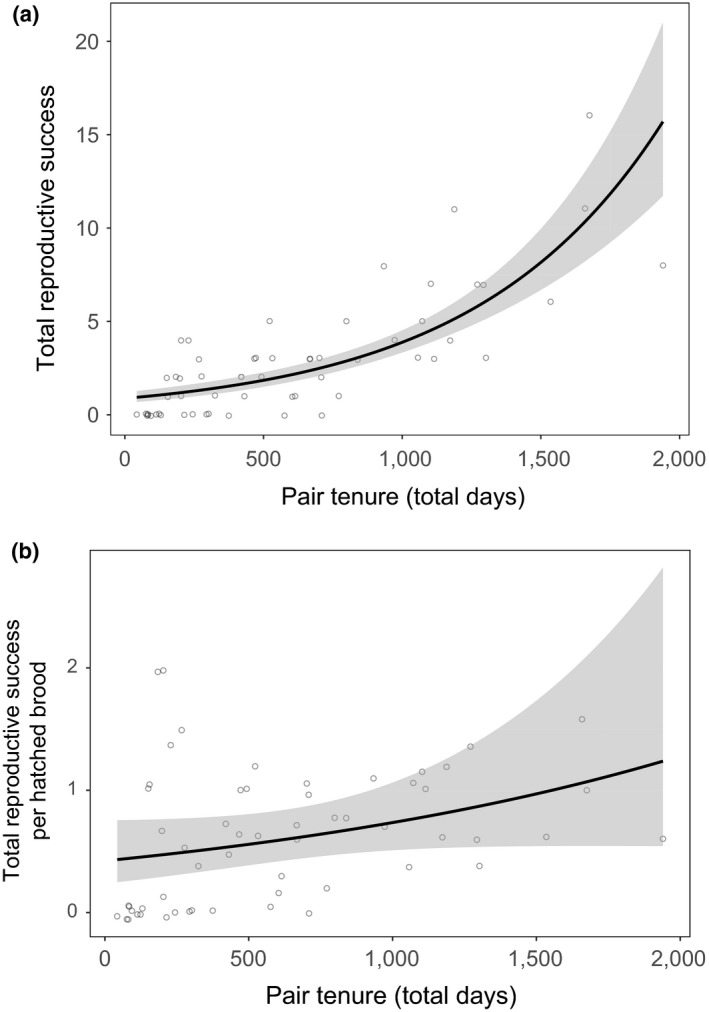
Figure 5.

(a) The relationship between reproductive success (total number of chicks reaching adulthood that a pair raise together) and complete pair tenure (total length in days). The fitted regression line is shown with shaded 95% confidence intervals. Data points are integers and have been jittered for better visibility. (b) The relationship between total reproductive success per hatched brood (over entire pair duration) and complete pair tenure (total length in days). The fitted regression line is shown with shaded 95% confidence intervals. Data points are integers and have been jittered for better visibility
