Figure 6.

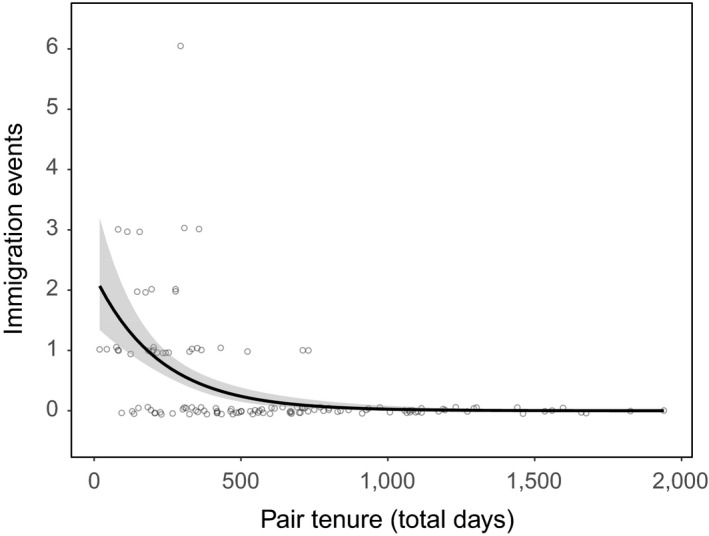
The relationship between immigration events and complete pair tenure (total length in days). The fitted regression line is shown with shaded 95% confidence intervals. Data points are integers and have been jittered for better visibility

The relationship between immigration events and complete pair tenure (total length in days). The fitted regression line is shown with shaded 95% confidence intervals. Data points are integers and have been jittered for better visibility